Active research areas:
Assessing the climate change mitigation potential of wetland restoration in the Conservation Reserve Program
Wetland restoration under the Conservation Reserve Program (CRP) can re-build soil organic carbon (SOC) lost during wetland agricultural production. This project represents a large multi-institutional effort to assess the climate mitigation benefits of wetland CRP practices on SOC and greenhouse gases (GHGs) associated with wetland drainage, cropping and restoration activities across diverse landscapes. The models developed will directly compare C stocks and GHG fluxes of CRP wetlands to drained and native prairie wetlands to establish net effects of land-use change. As part of this, we will explore how climate, surrounding land-use, soils and hydrology impact wetland C cycling and use these relationships to model and scale across space and time.
Wetland restoration under the Conservation Reserve Program (CRP) can re-build soil organic carbon (SOC) lost during wetland agricultural production. This project represents a large multi-institutional effort to assess the climate mitigation benefits of wetland CRP practices on SOC and greenhouse gases (GHGs) associated with wetland drainage, cropping and restoration activities across diverse landscapes. The models developed will directly compare C stocks and GHG fluxes of CRP wetlands to drained and native prairie wetlands to establish net effects of land-use change. As part of this, we will explore how climate, surrounding land-use, soils and hydrology impact wetland C cycling and use these relationships to model and scale across space and time.
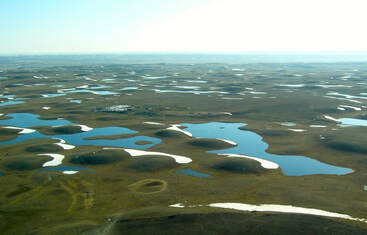
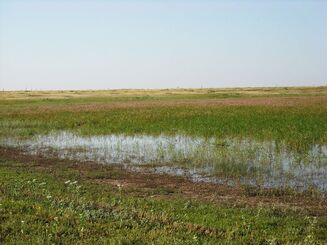
Estimating surface water in depressional wetlands
Landscape-scale estimates of surface water in prairie potholes, depressional wetlands common to the U.S. Great Plains, are needed to inform wildlife conservation planning. When wet, potholes provide critical habitat for 50-80% of North America’s breeding waterbirds. We are creating a multi-sensor algorithm that can map wet-dry cycles at the spatial and temporal scales needed by conservation planners. This project should also help evaluate drivers of surface water change in these systems to better understand future habitat availability.
Landscape-scale estimates of surface water in prairie potholes, depressional wetlands common to the U.S. Great Plains, are needed to inform wildlife conservation planning. When wet, potholes provide critical habitat for 50-80% of North America’s breeding waterbirds. We are creating a multi-sensor algorithm that can map wet-dry cycles at the spatial and temporal scales needed by conservation planners. This project should also help evaluate drivers of surface water change in these systems to better understand future habitat availability.
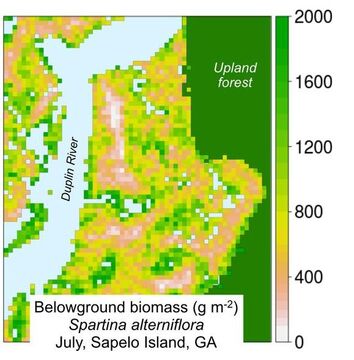
BERM: The Belowground Ecosystem Resiliency Model for forecasting coastal marsh resiliency
Changes over time in belowground productivity can provide insight into coastal marsh resiliency because belowground biomass helps marsh soils to accrete vertically, allowing them to keep pace with sea level rise and prevent marsh downing. Thus areas with persistently declining belowground biomass may soon convert to open-water ponds. We are creating models that rely on open-source methods to identify areas with declining belowground biomass, and that are thus potentially vulnerable to global climate change.
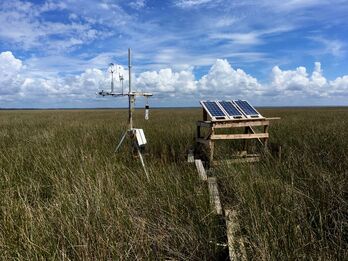
Mapping gross primary production in coastal marshes
We're using remote sensing and eddy covariance carbon flux data to quantify gross primary production in Atlantic and Gulf Coast tidal marshes. Study sites include the Georgia Coastal Ecosystems Long-Term Ecological Research site on Sapelo Island, GA, Grand Bay, MS, and Bayou Sauvage NWR, LA.
We're using remote sensing and eddy covariance carbon flux data to quantify gross primary production in Atlantic and Gulf Coast tidal marshes. Study sites include the Georgia Coastal Ecosystems Long-Term Ecological Research site on Sapelo Island, GA, Grand Bay, MS, and Bayou Sauvage NWR, LA.
Spatialtemporal patterns in marsh phenology
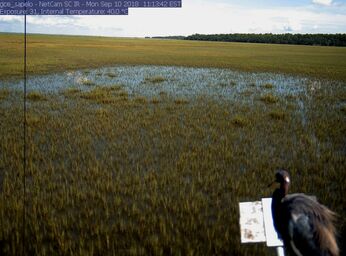
PhenoCam digital image time series can advance our understanding of plant phenology, especially in tidal marshes that experience microspatial variation in environmental stressors, such as tidal flooding. Thus far, we've created a smart-classifier that spatially parses the environmental information present in tidal marsh PhenoCam images. We also created the first spring green-up model for Spartina alterniflora, a ubiquitous salt marsh grass. This work revealed that salt marsh soil temperature is tied to small elevation changes, and is an important driver of microspatial plant phenology differences. We also use this information to inform downstream models of marsh plant production. Find images from the two GCE-LTER PhenoCams, including one in the Spartina alterniflora flux tower marsh, and our latest effort, a new camera at a Spartina-Juncus ecotone.
PhenoCam digital image time series can advance our understanding of plant phenology, especially in tidal marshes that experience microspatial variation in environmental stressors, such as tidal flooding. Thus far, we've created a smart-classifier that spatially parses the environmental information present in tidal marsh PhenoCam images. We also created the first spring green-up model for Spartina alterniflora, a ubiquitous salt marsh grass. This work revealed that salt marsh soil temperature is tied to small elevation changes, and is an important driver of microspatial plant phenology differences. We also use this information to inform downstream models of marsh plant production. Find images from the two GCE-LTER PhenoCams, including one in the Spartina alterniflora flux tower marsh, and our latest effort, a new camera at a Spartina-Juncus ecotone.
The Smart Classifier: Automated processing of the "GCE Sapelo" PhenoCam to allow phenometrics
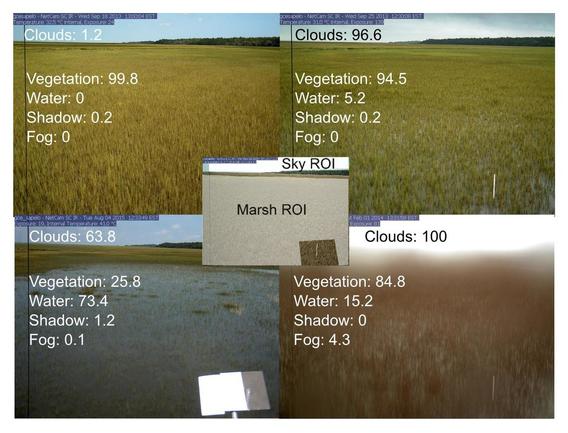
- Key finding: We created the smart classier to identify optimal digital images for phenology analysis. The smart classifier is a within image pixel classification algorithm that accounts for image context
- Read the manuscript online or my self-archived copy
- Find the script for the smart classifier here
- Download a reproducible example here
- Below left are 4 example images listing cover classes identified by the smart classifier, as well as the percent of the marsh and sky Regions of Interest (ROIs) covered by each class
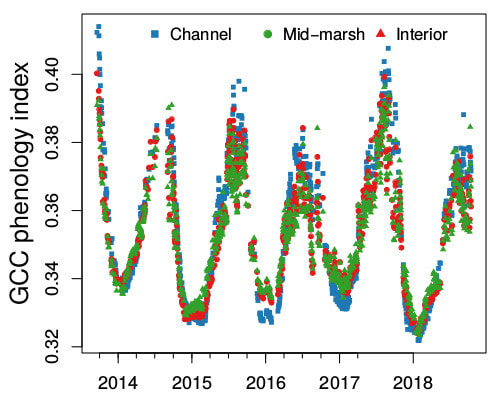
- Below right shows the GCC (Green Chromatic Coordinate), a phenology tracking index that was extracted from these PhenoCam images after smart classifier filtering. This panel suggests that phenology differed by > 1 month in marsh areas meters apart (see our upcoming paper on this soon!).
|
|